
Dashboard Development
Dashboard development for teams that actually open them at 9 a.m.
Operator dashboards, admin panels, and internal tools that turn warehouse data into decisions your team can act on.
What we ship
Operator dashboards, admin panels, embedded analytics, and internal tools. Real-time when it matters, batch when it does not.
- Real-time analytics dashboards
- Admin panels and back-office tools
- Multi-tenant SaaS dashboards
- Data visualization with D3, Recharts, and ECharts
- Role-based access and audit trails
The right chart for the question
Most dashboards fail because they were built around the data that was easy, not the questions operators are asking. We start with the question.
-
Time-series with smart aggregation and decimation
-
Cohort and funnel analysis with retention overlays
-
Geospatial views with clustering and heat maps
-
Hierarchical drill-downs and parent-child lookups
-
Dense data tables with virtualization and column pinning
-
Custom D3 visualizations when no library fits
Modern, fast, embeddable
The stack scales from a single dashboard to a multi-tenant analytics product. We default to the libraries that survive a long-term roadmap.
Frontend
- TypeScript
- React
- Next.js
- Recharts
- ECharts
- D3
Real-time
- WebSockets
- Materialize
- ClickHouse
- Kafka
- SSE
Data
- Snowflake
- BigQuery
- Postgres
- DuckDB
- dbt
Embedding
- JWT signing
- iframe sandboxing
- Theme tokens
- SSO bridges
Outcomes
Outcomes that change how your team works
A good dashboard is the cheapest way to change how a team makes decisions. These are the outcomes we have shipped to production.
- Operator decision time cut by 40–60% on consolidated dashboards
- p95 query latency under 200ms on data sets of 100M+ rows
- Six-figure tooling savings by retiring legacy BI subscriptions
- Embeddable views that ship in days, not quarters
- Real-time accuracy parity with the system of record
Operator dashboards in production
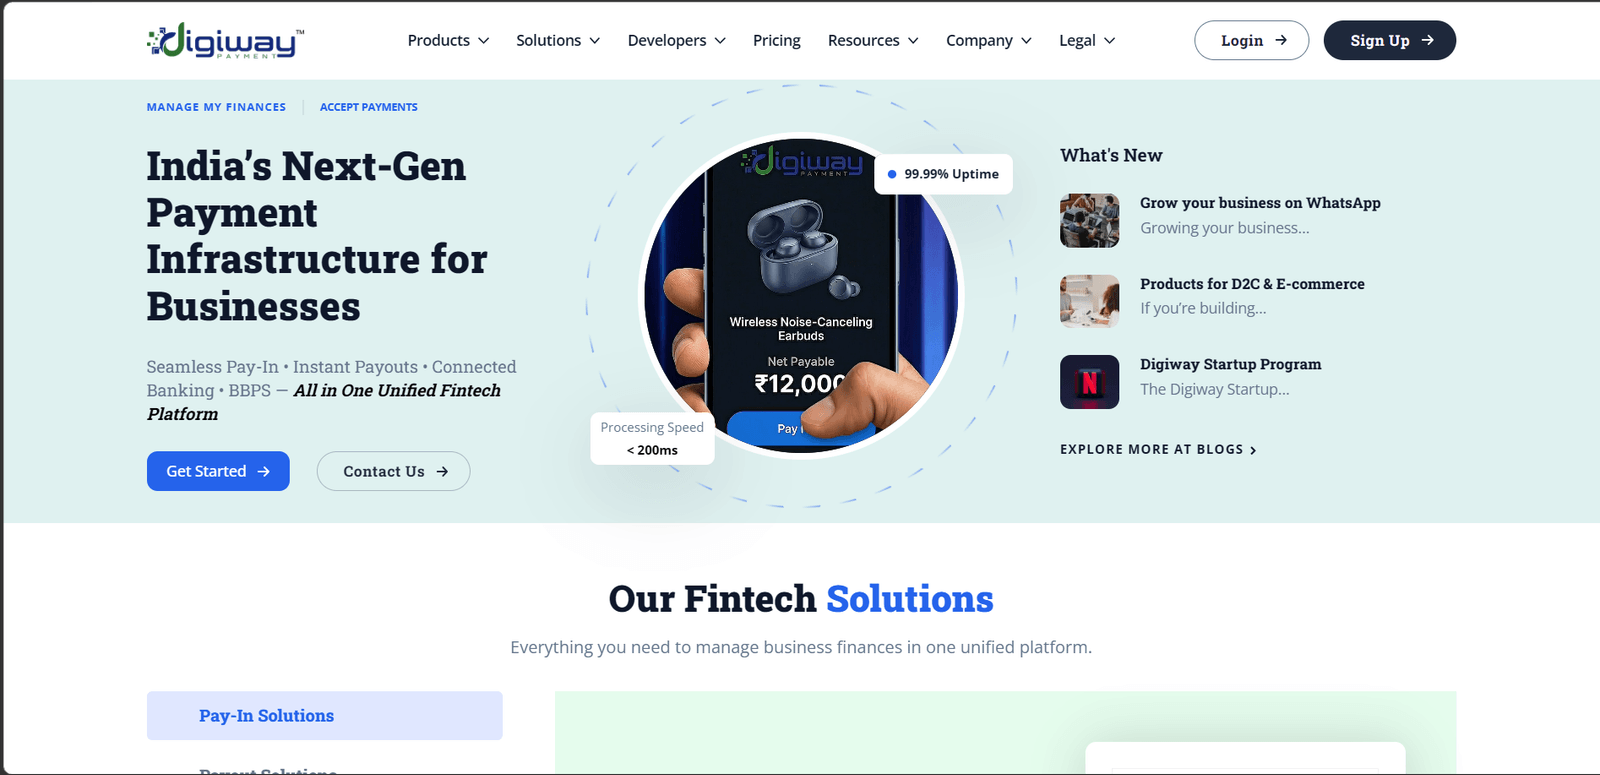
Digiway — Building a Scalable Payment Infrastructure Platform
A modern fintech ecosystem engineered to simplify merchant operations, payouts, transaction monitoring, and scalable payment workflows through a unified dashboard.

LeanMedia — Creator-First Influencer Marketing Platform
A unified platform for an influencer marketing agency that pairs in-house production and account management with a creator workspace and campaign command centre.
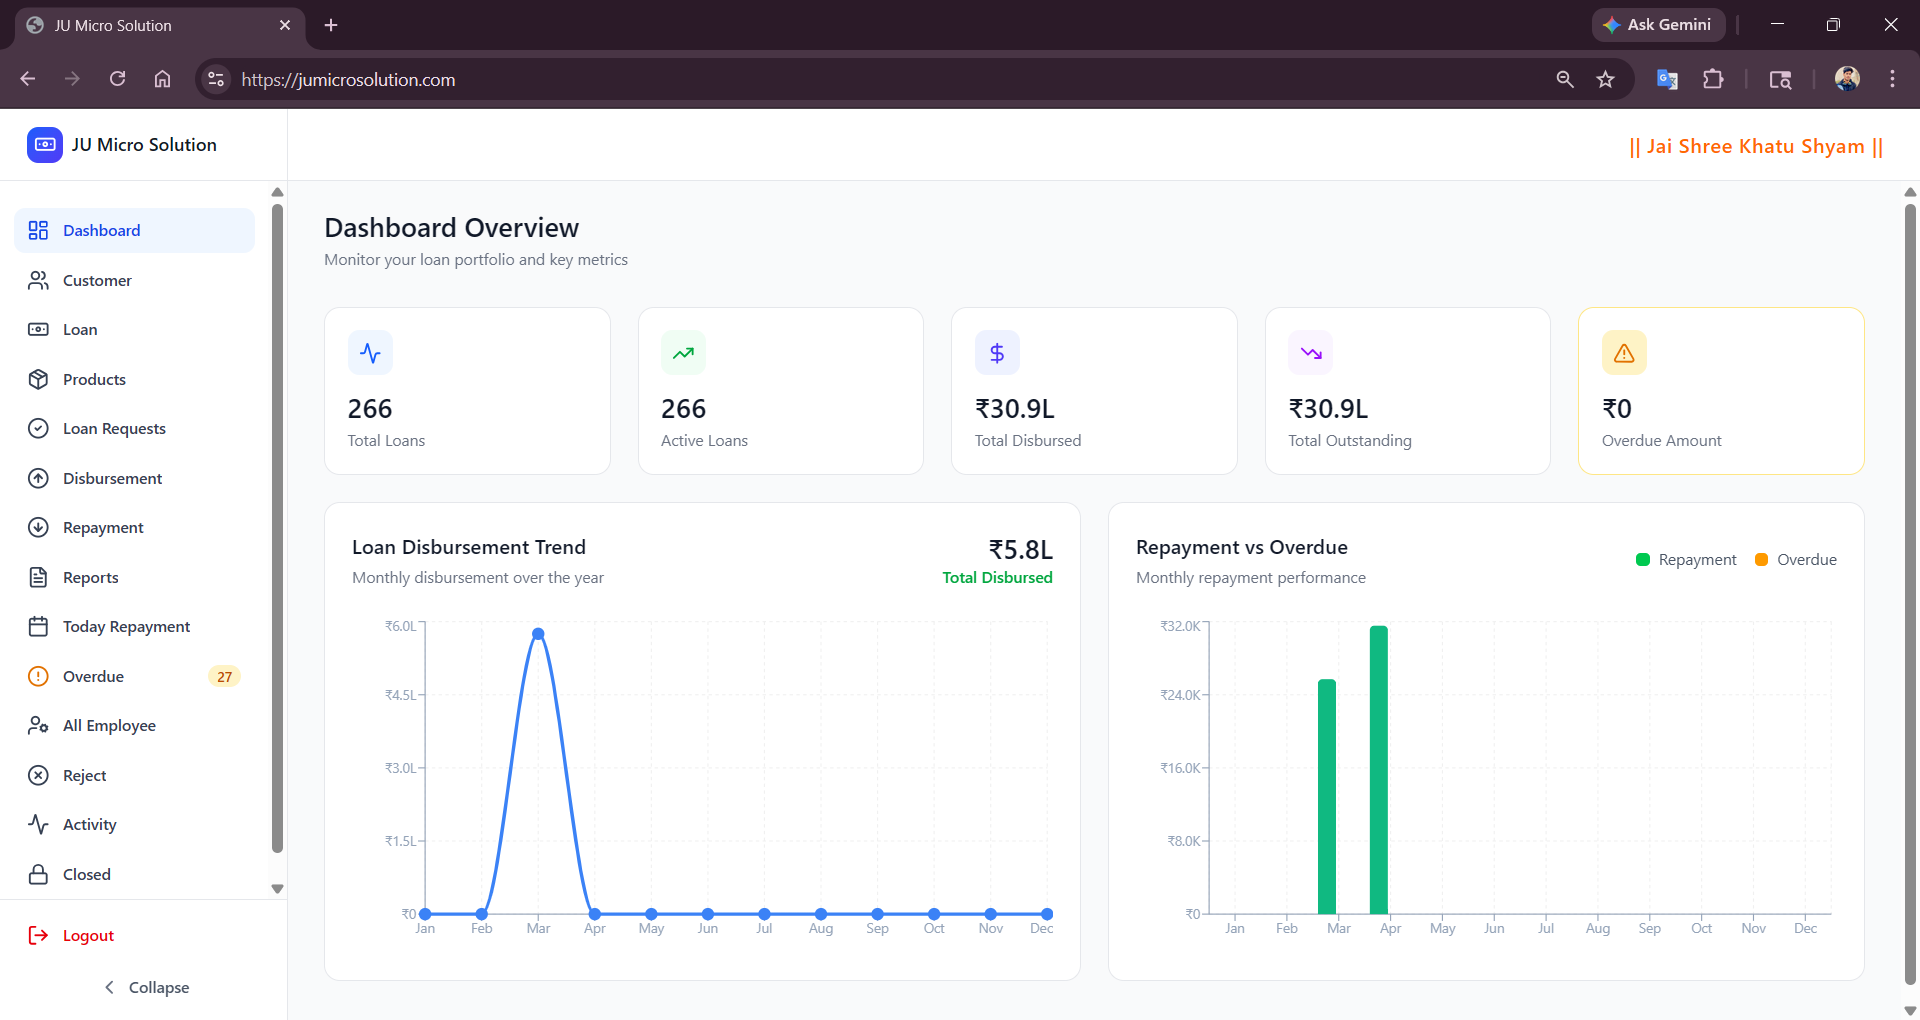
JU Micro Solution Foundation — Smart Loan Management Ecosystem
A multi-role loan management ecosystem with three field apps and a centralized web platform that lifted operational throughput 61% and brought dashboard responses under 140ms.
What teams ask before a dashboard build
What charting libraries do you use?
Do dashboards work on real-time data?
How do you handle role-based access?
Can dashboards be embedded in our product?
Field guides and definitions on dashboard engineering
Background on the engineering decisions behind every dashboard build.
-
Field guide
Why dashboards feel slow: seven fixes that actually help
The repeating dashboard performance mistakes and the fixes that move the needle.
-
Glossary
Operator dashboard
The internal-facing dashboard support, ops, and risk teams use every day.
-
Glossary
Embedded analytics
Charts and dashboards rendered inside a SaaS product so customers analyze their own data.
Let's build it together
Ready to give your operators one view instead of four?
A 30-minute call on the data you have, the questions you need to answer, and what an honest first dashboard looks like.